
Data Analysis
I work with real business data, applying SQL, financial analysis, and problem-solving techniques to extract patterns, validate metrics, and answer concrete business questions.

Visualization
I design clear and interactive dashboards using Power BI, Domo, Excel, and Looker Studio, focusing on business-ready insights that support managers and stakeholders.

Data Modeling & BI Solutions
I build structured data models, ETL processes, and input/output schemas using SQL, Python, Power Query, and Cloud environments, ensuring data quality and consistency across reports.

About me
I am a data analyst with hands-on experience delivering BI and analytics solutions across financial and operational projects. With an engineering background, I work across the full data workflow—translating business needs into structured data models, analytical processes, and clear visual insights.
My work involves querying and transforming data, validating metrics, and exploring datasets to surface patterns that support decision-making. I combine structured querying, data preparation workflows, and analytical scripting with dashboards in Power BI, Excel, Domo, and other BI tools.
I collaborate closely with stakeholders to define KPIs and build analytical solutions that are accurate, actionable, and aligned with business context. I see data analytics as a long-term craft built on rigor, curiosity, and continuous improvement.
View a sample of my work
Stored on Github
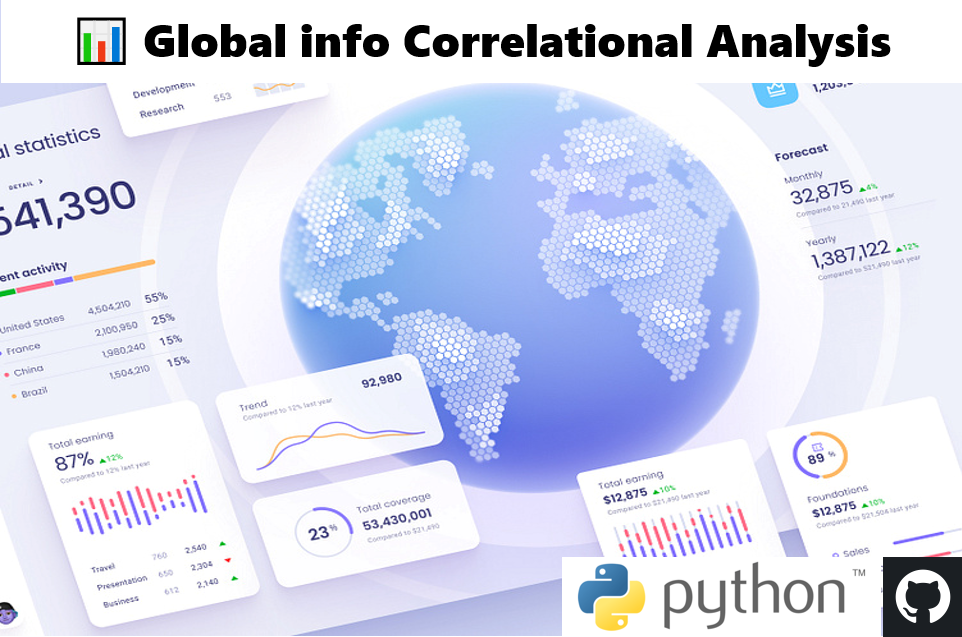
A cross-domain global data analysis project that uses correlation matrices and heatmaps to uncover structural relationships between economic, health,
education, demographic, environmental, and geopolitical indicators, identifying key development patterns and systemic interactions across countries.
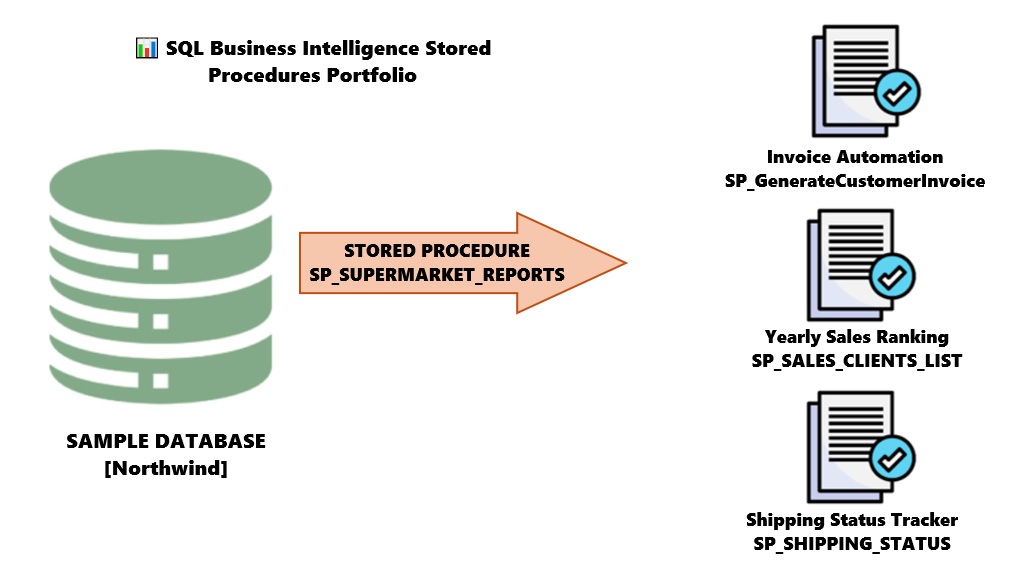
A SQL Server portfolio project that implements automated invoicing, customer sales ranking, and shipping status reporting using the Northwind database to demonstrate structured business logic, KPI calculations, and production-style stored procedure development.
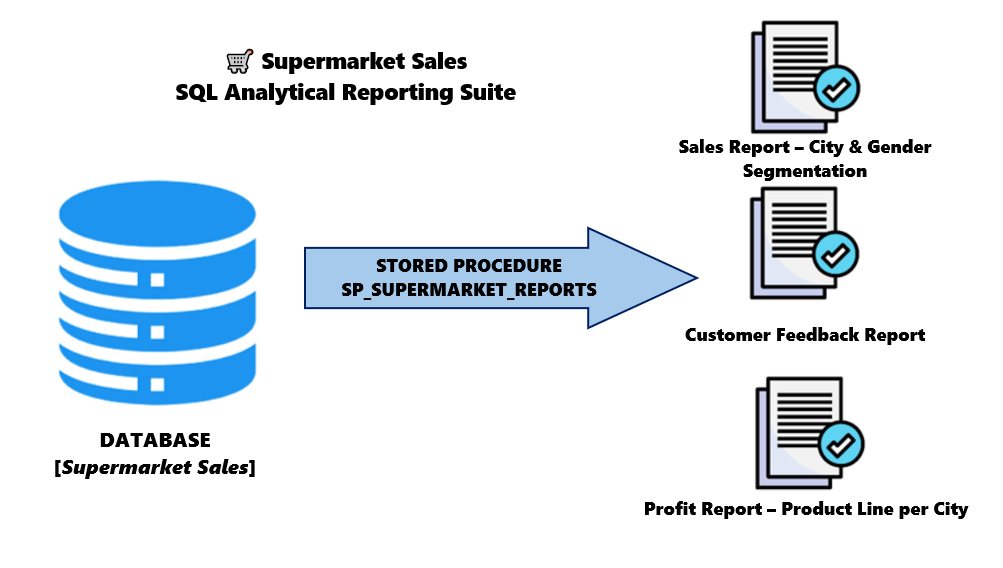
A SQL Server analytical project that builds a multi-report stored procedure to transform retail transactional data into structured sales, customer satisfaction, and profitability KPIs, demonstrating advanced T-SQL reporting logic and database-layer metric modeling.

An end-to-end exploratory data analysis of medical insurance records (1,338 observations) focused on identifying key cost drivers and evaluating how demographic and lifestyle variables influence annual healthcare expenses. The project applies structured data cleaning, distribution analysis, regression visualization, and correlation modeling to uncover that smoking status is the strongest predictor of high charges, followed by BMI and age, while gender and region show limited predictive power.
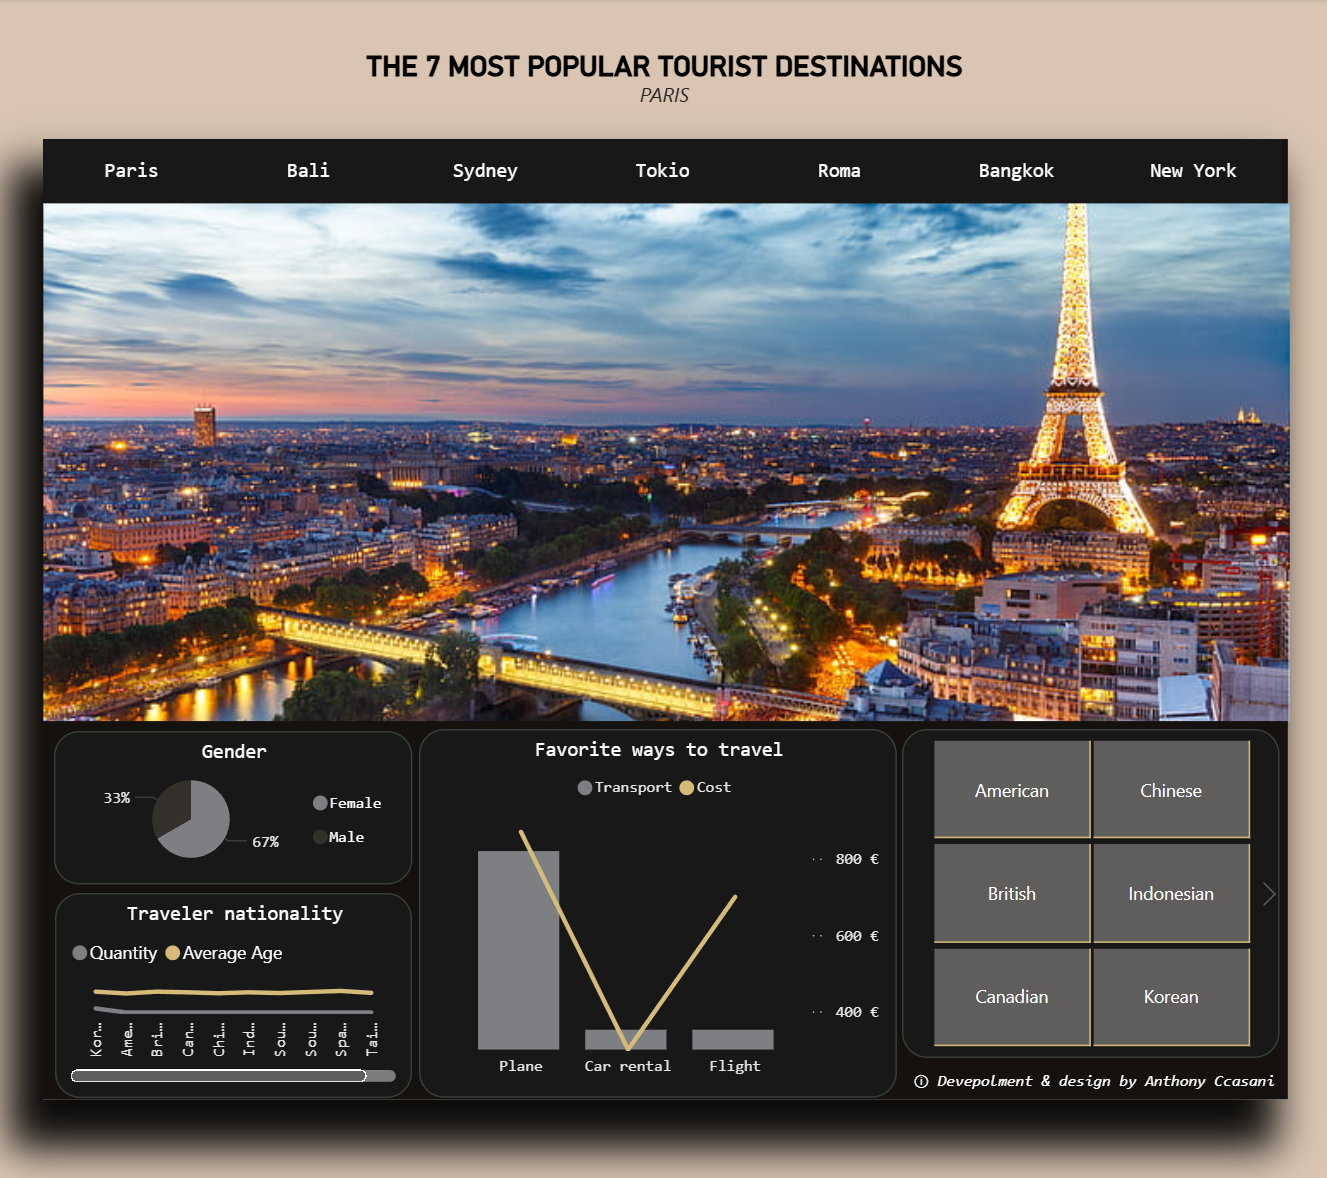
An interactive Power BI dashboard analyzing travel preferences, demographics, nationality patterns, and transportation costs across seven major global tourist destinations, designed to uncover
behavioral trends and tourism segmentation insights.

A structured exploratory analysis of lifestyle, health, and sleep metrics (374 records) aimed at understanding behavioral and physiological factors affecting sleep quality and duration. Using regression analysis, violin plots, grouped comparisons, and correlation heatmaps, the project reveals strong associations between stress level and sleep quality, positive relationships between physical activity and sleep duration, and subtle age-related trends, demonstrating applied health analytics methodology using Python.
Customer & Colleague words
Luis Fernández
«Anthony is someone you can trust to deliver solid analytical work.»
— BI Analyst
Carla Rodríguez
«He was able to turn complex datasets into insights we could actually use. His work supported better planning and more informed decisions.»
— Project Manager
Jorge Castillo
«Working with Anthony meant more structured data workflows and reliable reports. He consistently delivered results that added real analytical value.»
— Data Lead
